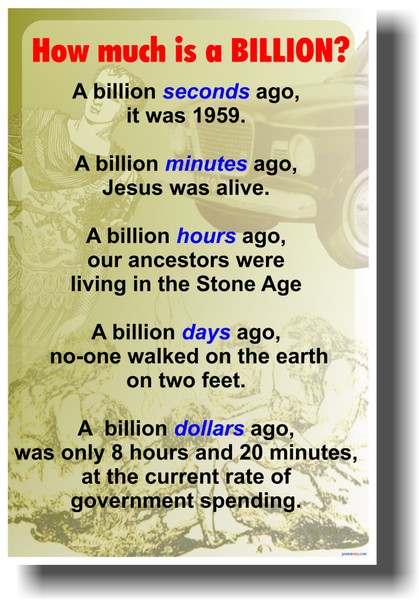
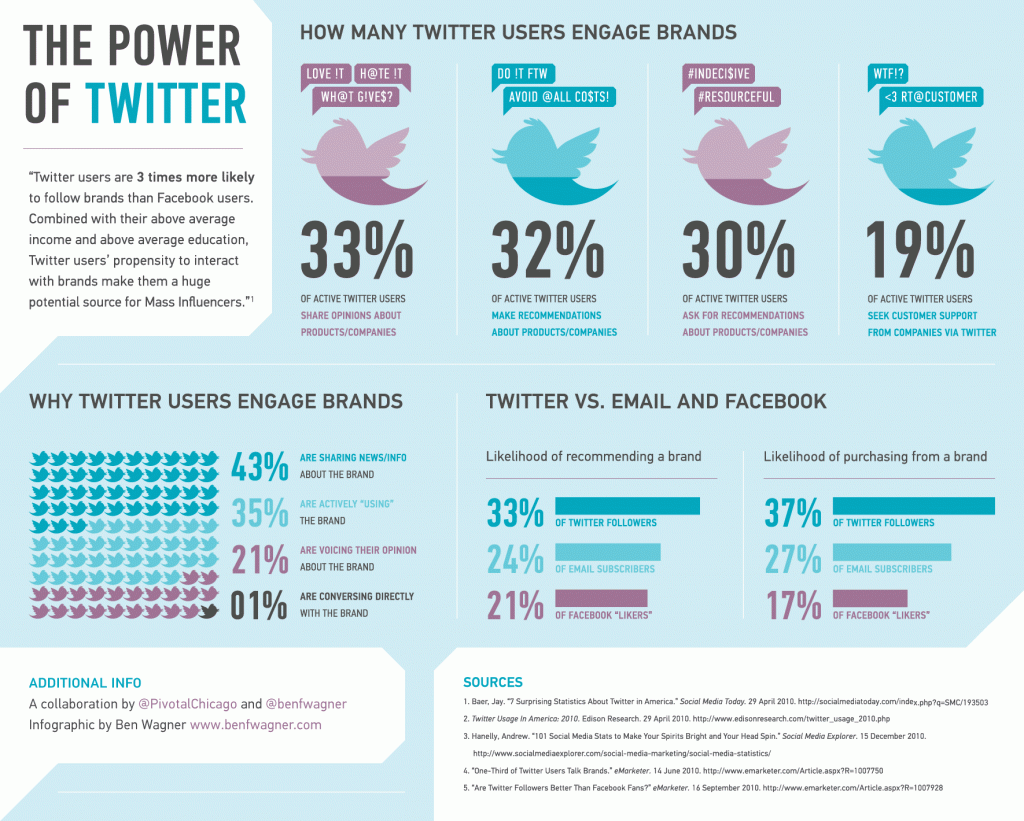
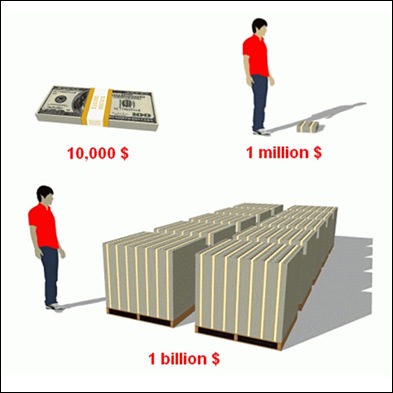
#DadChat recently surpassed one billion impressions for the first few months of 2013 – an impressive number, but so what? Numbers and statistics are bandied about by just about everyone. It starts with our age. When we’re little kids we tell our age in fractions – heck, mom and dad say “Little Sally” is 7 1/2 months old, if asked. Once our kids are old enough to say their age, it’s usually with fingers and a fraction AND often with “I’m going to be FOUR!” Once you’re my age, you stick with your current age until the DAY of your next birthday. But, how much is one billion? How much is one trillion? And, what do numbers like these mean in Social Media?
The ONLY class I took for my MBA (at U.C.L.A.) that has stuck with me, was Statistics. My first career was in the television business and I was the only person I knew who could explain the Nielson ratings and what they meant. Thankfully, that was a specific example used in that Statistics class. Today, Social Media uses statistics and numbers all the time. Of course, so does Washington – and often in misleading ways.
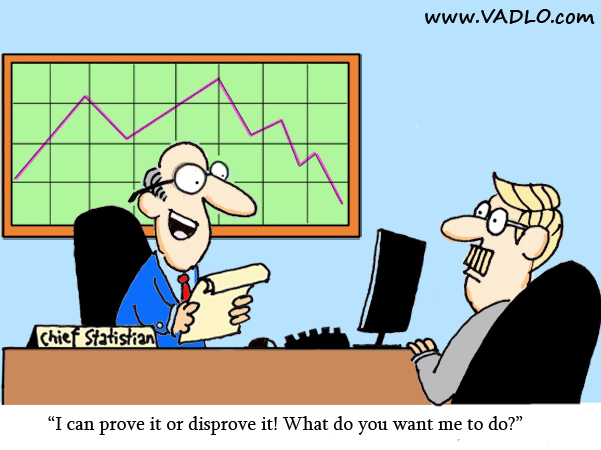
I learned another thing in Statistics. And, that is that most any statistics can be spun to say what you want them to say. Again, D.C. is the perfect example. Job report comes out and one sides trumpets the progress while the other laments the problems. In the case of politics, I sincerely believe that these stats are mis-used intentionally and are of little value. In Social Media, I believe they can be an honest reflection of many things and I am going to endeavor to explain them from my point-of-view.
There are hard stats that are undeniable, such as how old you are. There are stats that are function of an algorithm that is usually very subjective. Examples are any measurement of someone’s status via something like Klout or Kred (in Social Media) or any Top Ten list on any topic or subject.
I like the hard stats, but cannot escape the soft ones in my Social Media life. A mission of mine over the past year or so has been to educate Social Media managers and Brands/Companies/Services on the difference and value of a so-called “Twitter Party” versus an ongoing “Tweet Chat” such as my own #DadChat and #PetRap. For reference on this campaign of mine, see this vlog and read One-Half Billion.
Stats always come to play and I want to explain those that I use and why and what they mean.
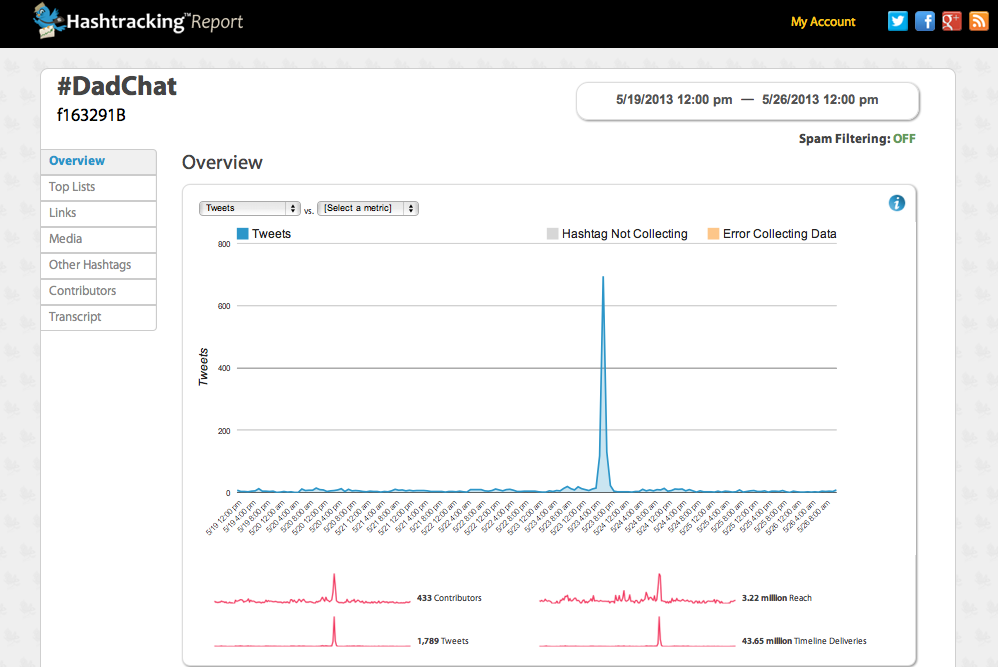
Let’s look at last week’s #DadChat statistical report that I get from Hashtracking:
First, note the date range for this report. It’s from Sunday May 19, at noon until Sunday May 26, at noon. It covers a full week’s time with the actual #DadChat taking place for only one scheduled hour on Thursday, May 23. Why then am I using a week to reflect a particular #DadChat? Simply, because as the graph indicates, there is pre-chat tweeting and post-chat tweeting. The week gives a reflection of the reality that #DadChat, or any good Tweet Chat, is a 24/7 interactive proposition whereas most Twitter Parties are singular events with a short shelf-life.
Now, let’s explain and analyze – with NO spin – the four statistics reflected in the screenshot (note, the full report has much more to offer, including a transcript of every tweet posted during the week’s timeframe).
Contributors: Pretty self-explanatory. This number is a real number of the exact amount of individual twitter accounts (presumably people) that tweeted at least one tweet with the #DadChat hashtag.
Tweets: Again, pretty self-explanatory as this is the exact number of tweets posted during the week’s time-frame that carried the #DadChat hashtag.
Reach: Okay, this is where things get more tricky and have the potential to be spun, however one might choose to spin. The reach is really a finite and real number that takes each contributor’s number of followers and adds them together. So, if every twitter handle/person had 1,000 followers and there were 100 contributors, the reach would be 100,000. Got it? You will be quizzed later.
Time-Line Deliveries aka Impressions: Now, this is the statistic that is most manipulated, misused, and misunderstood! Let’s use the Billboard analogy. When a company pays the rent for a billboard, it is always based on “impressions” that are garnered by a device that measures – in the case of a highway billboard – how many cars pass that specific billboard in any given period of time.
What does that mean? It simply means that, let’s say, 10,000 cars pass a particular billboard in one day. It does not measure, nor can it measure, how many of those cars actually see the billboard. Going further, it can’t measure, or could it measure, how many of those people in those cars actually saw and registered what they saw on that billboard.
Impressions aka Time-Line Deliveries are much the same. They represent how many potential people might or could have seen the tweets.
It is computed in a more complicated fashion by multiplying the number of tweets by each tweet person’s number of followers. So, if 100 people each has 1000 followers and each tweeted 10 times, the number of impressions would be 100 X 1000 X 10 or 1,000,000.
What does all this mean and how is a billboard and its impressions different from a Tweet Chat and its impressions? The answer, naturally, is nuanced but I will do my best to give an objective answer. The difference is that we also have NO IDEA how many people may have seen any one of those tweets aka impressions. So, truly, it’s almost a fictional number. BUT, a tweet has a life of its own. People can read it anytime they see it – IF they see it – in their stream. And, people that like a particular person or hashtag, can seek out those tweets.
When any of these tweets are read and they happen to have a link within them, the reader can choose to go to that link, choose to read the blog, ad, see the photo, video, etc. So, the opportunity for interaction is real. That opportunity is almost negligible is most every other form of advertising. Why do you think phone numbers and website addresses are repeated so many times in radio ads? How many of you have EVER written down info from a billboard? The best a billboard can hope for is building brand recognition so that repeatedly seeing a Nike or Apple billboard motivates you to walk into the Apple or Nike store when you pass it at the mall.
A tweet offers so much more. That is why I’m so proud to report that #DadChat has surpassed one billion – yes, that’s 1,000,000,000 – impressions in May of 2013, after just the few short months since the beginning of 2013.
#DadChat’s numbers for the first few months of 2013 – more or less (since an exact report isn’t complete) are:
Contributors: Over 2,500.
Tweets: Over 27,000.
Reach: Over 20,000,000.
Impressions: Over ONE BILLION…
I’m impressed, proud, and I can’t fully tell you what it means! I do know that it means #DadChat and other successful weekly Tweet Chats are “reaching” a lot of people. I know the potential for meaningful interaction is totally there and I know that this form of communication AND marketing is right at the beginning of its arc and its ascent to be a meaningful marketing and advertising tool. Stay tuned…
How about skipping that $5 Starbucks latte and splurging $2.99 (for the Kindle on Amazon) or $2.79 for the PDF of my new e-book? Enjoy my own informercial for it! This e-book is really a virtual journey. It’s filled with 100 photos, 7 original videos, and links to many of the stops on the trip. Click on the book cover image below to find your purchase options:

